Search results
Search for "background subtraction" in Full Text gives 42 result(s) in Beilstein Journal of Nanotechnology.
Modulated critical currents of spin-transfer torque-induced resistance changes in NiCu/Cu multilayered nanowires
Beilstein J. Nanotechnol. 2024, 15, 360–366, doi:10.3762/bjnano.15.32

- of STT-assisted resistance switching in multilayered nanowires, raw data before the background subtraction, a schematic diagram of the four-point measurements at low temperature, 2D color maps of (dV/dI)red over a larger current range and under upsweep of the magnetic field, the potential influence


Controllable physicochemical properties of WOx thin films grown under glancing angle
Beilstein J. Nanotechnol. 2024, 15, 350–359, doi:10.3762/bjnano.15.31

- curve fitting after Shirley background subtraction [38]. The two major symmetric peaks at 35.87 and 38.00 eV binding energies correspond to the 4f7/2 and 4f5/2 levels (spin–orbit splitting: 2.13 eV), respectively, indicating the presence of W6+ in the as-deposited WOx films [38][39]. The two minor peaks


Nanocarrier systems loaded with IR780, iron oxide nanoparticles and chlorambucil for cancer theragnostics
Beilstein J. Nanotechnol. 2024, 15, 180–189, doi:10.3762/bjnano.15.17

- incubation at 37 °C. n = 3. The fluorescence signal of F127-folate@NP/Cou-6, F127-folate@NP/Cou-6, and PVA@NP/Cou-6 in 3T3, HEK, HEPG2, and MCF-7 after background subtraction (n = 3). MTT assays of the nanoparticles incubated with HepG2, MCF7, 3T3, and HEK for 48 h (dark color) and 72 h (light color). Cells


A combined gas-phase dissociative ionization, dissociative electron attachment and deposition study on the potential FEBID precursor [Au(CH3)2Cl]2
Beilstein J. Nanotechnol. 2023, 14, 1178–1199, doi:10.3762/bjnano.14.98

- selected area of the SEM image shown in Figure 1a is depicted in Figure 1c, where nanoparticles in the deposition are noticeable, although the picture is somewhat blurry. To better visualize the observed nanoparticles, a background subtraction was performed with the image enhancement program ImageJ [35
- ]. The image after the background subtraction is shown in Figure 1d, where the particles can be more clearly distinguished. After background subtraction, some of the deposited nanoparticles appear facetted; however, the majority are spherical. HAADF-STEM on FEBID (SiO2 (500 nm)/Si(111)) As a next step


Hierarchically patterned polyurethane microgrooves featuring nanopillars or nanoholes for neurite elongation and alignment
Beilstein J. Nanotechnol. 2023, 14, 1157–1168, doi:10.3762/bjnano.14.96

- ) Fluorescence micrographs (merged) of PC12 cells with stained actin, beta-III tubulin, and nucleus on PU flat (A), nanopillar (B), and nanohole (C) substrates. (White arrowheads indicate short projections. Background subtraction and brightness/contrast adjustment were performed. For separate, non-background
- indicate short projections, while white double-headed arrows indicate the direction of the grooves. Background subtraction and brightness/contrast adjustment were performed. For separate, non-background-subtracted images, please refer to Supporting Information File 1, Figure S14.) (D–I) Quantification of


Evaluation of electrosynthesized reduced graphene oxide–Ni/Fe/Co-based (oxy)hydroxide catalysts towards the oxygen evolution reaction
Beilstein J. Nanotechnol. 2023, 14, 420–433, doi:10.3762/bjnano.14.34
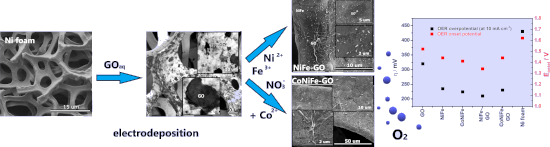
- Gaussian–Lorentzian (GL30) curve as a fitting algorithm and a Shirley background subtraction. Electrochemical studies The setup for the electrochemical studies was the same as for the fabrication of the catalysts (see section “Electrosynthesis and morphology of the deposits”) with some exceptions: The


Plasmon-enhanced photoluminescence from TiO2 and TeO2 thin films doped by Eu3+ for optoelectronic applications
Beilstein J. Nanotechnol. 2021, 12, 1271–1278, doi:10.3762/bjnano.12.94

- background subtraction and the least-square Gaussian–Lorentzian – GL(30) curve fitting algorithm. Calibration of obtained spectra to the binding energy of 285 eV for C 1s was conducted. Additionally, a built-in Ar ion gun was used to etch the surface of the films. To obtain depth profiles of the chemical


The role of convolutional neural networks in scanning probe microscopy: a review
Beilstein J. Nanotechnol. 2021, 12, 878–901, doi:10.3762/bjnano.12.66

- processing of HS-AFM data based on algorithms containing specific assumptions about the sample are often not robust when used for arbitrary samples [129][130][131]. CNNs work well in noise removal and could help in background subtraction, scar removal, and detection of other imaging artifacts. A recent


Integrated photonics multi-waveguide devices for optical trapping and Raman spectroscopy: design, fabrication and performance demonstration
Beilstein J. Nanotechnol. 2020, 11, 829–842, doi:10.3762/bjnano.11.68

- work, we will develop a background-subtraction procedure to recover the Raman signals that are obscured now by the background. We note that background signals of various shapes generated in Si3N4 waveguides are also observed by other groups in waveguide Raman spectroscopy [16][17]. Conclusion We have


Evolution of Ag nanostructures created from thin films: UV–vis absorption and its theoretical predictions
Beilstein J. Nanotechnol. 2020, 11, 494–507, doi:10.3762/bjnano.11.40

- of 4 mm was used for analyzing the emitted photoelectrons. The binding energies were corrected using the background C 1s line (285.0 eV). XPS spectra were analyzed with the Casa-XPS software using a Shirley background subtraction and Gaussian–Lorentzian curves as fitting algorithm. The theoretical


Porous N- and S-doped carbon–carbon composite electrodes by soft-templating for redox flow batteries
Beilstein J. Nanotechnol. 2019, 10, 1131–1139, doi:10.3762/bjnano.10.113

- ), using a Mg Kα source (1253.6 eV). For analysis, the peaks were fitted using Gaussian and Lorentzian functions with identical FWHM for each component of the same element after manual background subtraction [32]. Electrochemical characterization All electrochemical measurements were carried out with a


Widening of the electroactivity potential range by composite formation – capacitive properties of TiO2/BiVO4/PEDOT:PSS electrodes in contact with an aqueous electrolyte
Beilstein J. Nanotechnol. 2019, 10, 483–493, doi:10.3762/bjnano.10.49

- and 300 W. XPS measurements were performed at room temperature under ultrahigh-vacuum conditions, with pressures below 1.1 × 10⁻⁸ mbar. Data analysis was performed with the CASA XPS software package using Shirley background subtraction and a least-squares Gaussian–Lorentzian curve fitting algorithm


Nanocomposite–parylene C thin films with high dielectric constant and low losses for future organic electronic devices
Beilstein J. Nanotechnol. 2019, 10, 428–441, doi:10.3762/bjnano.10.42

- transform infrared spectrometer (FTIR, Nicolet 380) in reflectance mode at a resolution of 4 cm−1 in a wave number range from 400 to 3200 cm−1. The spectra were obtained after a previous background subtraction with 32 scans for each sample to remove the contribution of H2O and CO2 molecules. Dielectric


Mechanism of silica–lysozyme composite formation unravelled by in situ fast SAXS
Beilstein J. Nanotechnol. 2019, 10, 182–197, doi:10.3762/bjnano.10.17

- , normalizations and correction for transmission, instrumental background subtraction and data integration of the collected 2D data to 1D. Further data processing and water background subtraction, model fitting, validation and analysis, were performed through a custom-made script developed in GNU Octave [64][65


Nanoporous water oxidation electrodes with a low loading of laser-deposited Ru/C exhibit enhanced corrosion stability
Beilstein J. Nanotechnol. 2019, 10, 157–167, doi:10.3762/bjnano.10.15

- each spectrum into individual mixed Gaussian–Lorentzian peaks using a Shirley background subtraction over the energy range of the fit. Finally, all spectra were shifted to give a C 1s binding energy position of 284.4 eV to correct for a slight overcompensation in the neutralization. Electrochemical


Nanoantenna structures for the detection of phonons in nanocrystals
Beilstein J. Nanotechnol. 2018, 9, 2646–2656, doi:10.3762/bjnano.9.246

- ) after background subtraction. f) IR transmission spectra of microantenna arrays before NC deposition (black circles) and after covering with different ML quantities for CdSe NCs. Figure 8a and 8b are reprinted with permission from [23], copyright 2017 American Chemical Society. Acknowledgements The


Au–Si plasmonic platforms: synthesis, structure and FDTD simulations
Beilstein J. Nanotechnol. 2018, 9, 2599–2608, doi:10.3762/bjnano.9.241

- ). XPS spectra were analyzed with the Casa-XPS software using a Shirley background subtraction and Gaussian–Lorentzian curves for fitting. UV–vis spectra were recorded by a double-beam Thermo Fisher Scientific Evolution 220 spectrophotometer in reflectance mode. The spectra were recorded in a range of


Towards the third dimension in direct electron beam writing of silver
Beilstein J. Nanotechnol. 2018, 9, 842–849, doi:10.3762/bjnano.9.78

- sample current of around 5 nA with a take-off angle of 42° and 30 s acquisition time. The two voltages yielded two independent sets of data for the extraction of the k-ratios of each atom. After background subtraction these k-ratio values together with the deposit thicknesses served as input for the SAMx


Ta2N3 nanocrystals grown in Al2O3 thin layers
Beilstein J. Nanotechnol. 2017, 8, 2162–2170, doi:10.3762/bjnano.8.215

- resolution was around 0.8 eV. All spectra were calibrated by the position of the C 1s peak, placed at a binding energy of 284.5 eV. The photoemission spectra were simulated with several sets of mixed Gaussian–Lorentzian functions with Shirley background subtraction [24]. The in-depth distribution of Ta bonds


Identifying the nature of surface chemical modification for directed self-assembly of block copolymers
Beilstein J. Nanotechnol. 2017, 8, 1972–1981, doi:10.3762/bjnano.8.198

- HAXPES experiments on PS–OH grafted layers cooled under the selected conditions. Figure 3a shows the experimental HAXPES C 1s line (continuous black line) of the sample cooled in nitrogen together with a least-square fit after background subtraction (see caption of figure for details). The most prominent
- deposited on top of grafted brush layers that have been unexposed and exposed to oxygen plasma, respectively, without prior EBL modification. Figure 5a,b shows the C 1s HAXPES spectra acquired with 3000 eV photons together with the deconvolution using least-square fits after background subtraction. Both
- in nitrogen and exposed to oxygen plasma, taken with 2020 eV using a SCIENTA R4000 hemispherical analyser. Least-square fits of the experimental data (continuous black line) after background subtraction (Shirley-type) are shown in (a) and (c) using a combination of Gaussian (70%) and Lorentzian (30


Bright fluorescent silica-nanoparticle probes for high-resolution STED and confocal microscopy
Beilstein J. Nanotechnol. 2017, 8, 1283–1296, doi:10.3762/bjnano.8.130

- software ImageJ (Version: 1.45a; http://rsbweb.nih.gov/ij/). In brief, after background subtraction and adjustment of brightness and contrast the SEM or TEM images were converted to 8-bit binary images. Particle size diameter and shape were counted automatically. Zeta-potential measurements: The ζ


Preparation of thick silica coatings on carbon fibers with fine-structured silica nanotubes induced by a self-assembly process
Beilstein J. Nanotechnol. 2017, 8, 1145–1155, doi:10.3762/bjnano.8.116

- equipped with a Gatan image filter. Holey carbon-coated copper grids were used for sample preparation. Atomic force topographic images were sampled by means of an Agilent 5500 AFM with MAC III controller operating in tapping mode. A polynomial background subtraction was applied for image processing


Fully scalable one-pot method for the production of phosphonic graphene derivatives
Beilstein J. Nanotechnol. 2017, 8, 1094–1103, doi:10.3762/bjnano.8.111

- the emitted photoelectrons. The binding energies were corrected using the background C 1s line (285.0 eV) as a reference [29]. XPS spectra were analysed with Casa-XPS software using a Shirley background subtraction and Gaussian–Lorentzian fits. Simultaneous thermogravimetric analysis (TGA) and


Nanoantenna-assisted plasmonic enhancement of IR absorption of vibrational modes of organic molecules
Beilstein J. Nanotechnol. 2017, 8, 975–981, doi:10.3762/bjnano.8.99

- spectra with the IR spectra of 3 nm and 10 nm thick CoPc films on a Si substrate without nanoantennas (curves 4 and 5, respectively). (b) Comparison of IR spectrum of bare nanoantennas (curve 1) and with the spectrum of the structure with the 3 nm thick CoPc film (curve 2) after background subtraction. (a


Phospholipid arrays on porous polymer coatings generated by micro-contact spotting
Beilstein J. Nanotechnol. 2017, 8, 715–722, doi:10.3762/bjnano.8.75

- after background subtraction of dots indicated by an arrow. a) Fluorescence microscopy image of an anti-DNP IgE-Alexa 488 antibody (green) bound to an array of DNP-lipids on nanoporous HEMA-EDMA substrate. DOPC doped with Rhodamine-PE was patterned on the same sample as optical reference (red) with
- dwell time set to 1 s. Scale bar equals 50 µm. b) Fluorescence intensity of n = 5 dots features per dwell time of DNP-array (after background subtraction) presented in a) after binding the anti-DNP IgE-Alexa 488 antibody. Fluorescence microscopy images of ARbiot binding onto STV-Cy3 coated biotin arrays
- (red points) and ARbiot binding (green points) (after background subtraction). Acknowledgements This work was partly carried out with the support of the Karlsruhe Nano Micro Facility (KNMF, http://www.knmf.kit.edu), a Helmholtz Research Infrastructure at the Karlsruhe Institute of Technology (KIT


